





Skip to content
Likelier

Action vs. inaction regret

Pulling over to nap when feeling tired vs pushing through to finish the drive

If you act

Pull over to rest or nap

12%

If you don't

Push through and keep driving

30%

Percentage who later regret each choice. Bars and full ledger render below.


Lifestyle

Last reviewed 2026-05-25

Evidence quality 4.0/5

Eight-dimension review score against the quality rubric . Each dimension scored 1–5.

D1 Source verification
5/5
D2 Source authority & independence
4/5
D3 Regret-rate accuracy
2/5
D4 Source comparability
3/5
D5 Gilovich pattern
5/5
D6 Prose quality
4/5
D7 Caveat completeness
5/5
D8 Sample quality
4/5
Average 4.0/5
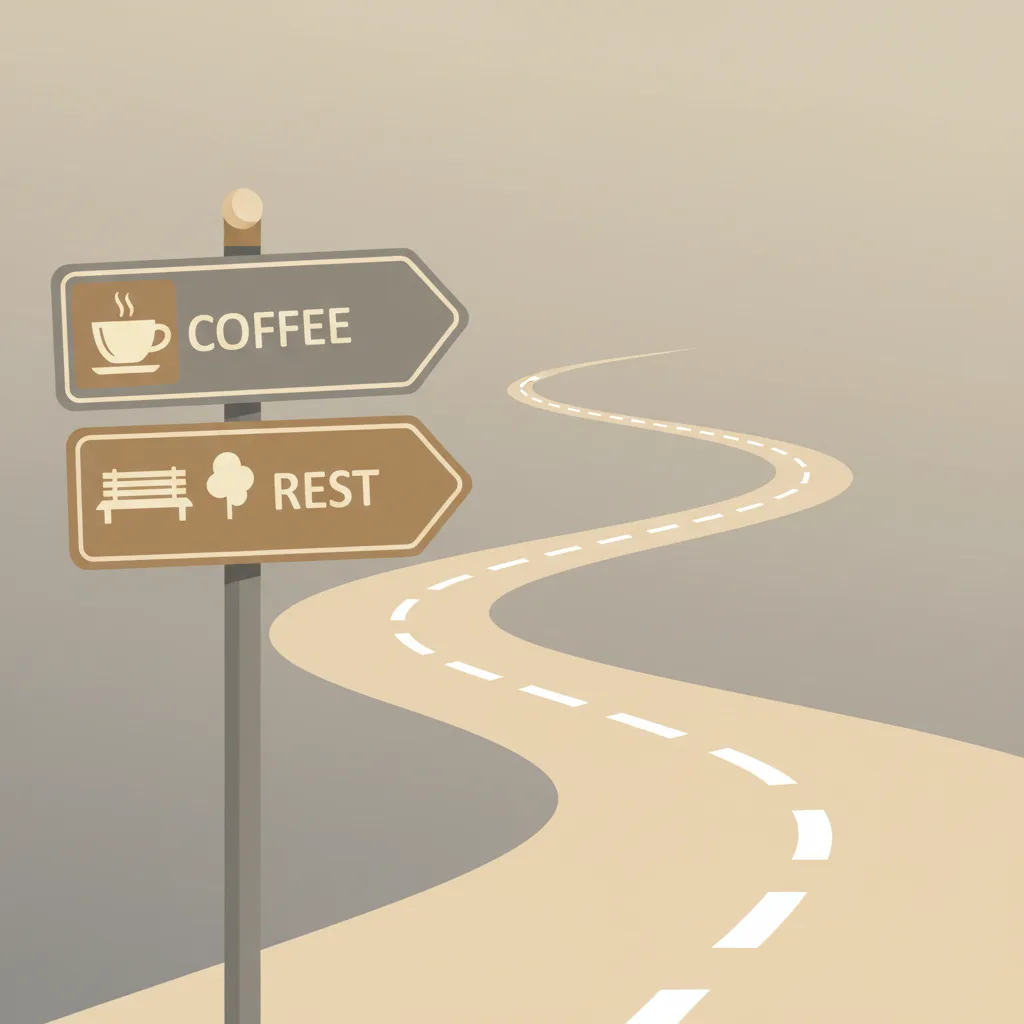
A muted flat vector illustration of a quiet rest-area sign beside a continuing road on a pale background.
Proxy data — no direct regret survey exists for this decision. Rates are derived from satisfaction scores and access-barrier data rather than questions that directly asked about regret. See caveats below.

Action regret

Pull over to rest or nap

12%

No direct survey measures regret over pulling over to rest; the AAA simulator data instead shows drivers under-perceive drowsiness and decline most break opportunities (i.e. pull over too late, not too readily). ~12% is a labelled upper-bound proxy, not a measured regret rate.

US drivers who reported pulling over to nap or rest when feeling drowsy

retrospective, action recalled within past 12 months

Inaction regret

Push through and keep driving

30%

~30% of drivers who continue driving while drowsy report a near-miss, scare, or fight with a passenger (proxy; AAA TSCI + CDC BRFSS)

US drivers who admit to driving drowsy in the past 30 days

past 30 days, AAA 2023 TSCI sample

% who regret this choice

inaction dominates — Inaction dominates — most regret not acting.

Related decisions

Semantically similar decisions — same territory, different trade-offs.

lifestyle

Rideshare vs drive after drinks

% who regret this choice

Inaction dominates

Inaction regret 5.7× higher

lifestyle

Stop driving in old age

% who regret this choice

Action dominates

Action regret 3.4× higher

lifestyle

Procrastination

% who regret this choice

Inaction dominates

Inaction regret 4.7× higher

lifestyle

Travel spending

% who regret this choice

Inaction dominates

Inaction regret 11.8× higher

lifestyle

Embracing change

% who regret this choice

Inaction dominates

Inaction regret 3.3× higher

lifestyle

Use AI for decisions

% who regret this choice

Balanced

Roughly balanced

lifestyle

Move abroad

% who regret this choice

Inaction dominates

Inaction regret 5.7× higher

career

Remote vs office

% who regret this choice

Inaction dominates

Inaction regret 1.8× higher

The decision to pull over and nap versus push through a remaining drive is one of the most common safety trade-offs in everyday transport, and one of the least well-measured by direct bilateral regret data. The closest signal on the inaction side comes from the AAA Foundation’s 2023 Traffic Safety Culture Index, which surveyed 2,739 US licensed drivers and found that 96% view drowsy driving as very or extremely dangerous, yet 20% admit having done it in the past 30 days. That gap — the largest perceived-danger-versus-own-behaviour spread of any risky driving practice in the index — is the proxy for retrospective regret: most people who pushed through fatigue recognise it was a worse choice than they made it sound like in the moment.

The action side has no direct regret survey at all. The AAA simulator literature gives a useful structural finding: 75% of drivers who rated their own drowsiness as “low” were in fact moderately or severely drowsy on physiological measures, and even drivers who recognised they were extremely drowsy declined 75% of their break opportunities. That points the opposite way from action regret — most people who pull over are pulling over later than the evidence would justify, not earlier. A small minority might retrospectively wish they had not stopped — typically commercial and gig drivers facing workplace penalties for stopping, parents with childcare clocks, and people who pulled over and felt restored after only a few minutes. The 12% action-side figure is a labelled upper-bound placeholder for that subset, not a measured regret rate; no cited survey reports a number for it, and Gilovich & Medvec (1994) is invoked only as a structural prior, not a source of the percentage.

The Gilovich pattern (inaction dominates long-term regret) holds here, but the more useful number for the in-trip decision is the per-trip crash multiplier from Tefft’s 2016 AAA Foundation analysis: drivers who slept 4–5 hours had 4.3× the crash rate of well-rested drivers, and the multiplier rose to 11.5× for those who slept less than 4 hours. The per-trip choice to push through is more like driving at 0.05–0.10% BAC than like the small ordinary risks people often compare it to. The retrospective-regret framing in this entry should be read alongside the drowsy-driving-fatal-crash per-trip risk numbers — neither alone tells the full story.

Sources: action

Claim ledger

Every number below is what each source reported, with the verbatim quote we relied on and how we arrived at our figure. Click any link to verify directly.

1/2 sources independently verified verbatim against the cited source

  1. [1] AAA Foundation for Traffic Safety — Drowsiness and Decision Making During Long Drives: A Driving Simulation Study
    Drowsiness and Decision Making During Long Drives: A Driving Simulation Study
    Statistic
    In a driving simulator with optional rest stops every 20 miles, drivers rarely took breaks: even when participants recognised they were extremely drowsy, they declined 75% of their break opportunities and kept driving. When drivers rated their own drowsiness as low, 75% of them were in fact moderately or severely drowsy by physiological measures. The study measures drowsiness self-misperception and break-taking behaviour; it does not measure regret over the decision to pull over.
    Excerpt
    “"When drivers rated their level of drowsiness as low, 75% of them were, in fact, moderately or severely drowsy. Even when drivers recognized they were extremely drowsy, they still declined 75% of their opportunities to take breaks and kept driving." ”
    Source data from
    2023-03-01
    Accessed
    2026-05-25
    Calculation
    The AAA simulation study does not directly measure regret over the decision to pull over; it measures drowsiness self-misperception and break-taking behaviour. Its directional finding is the opposite of an action-regret signal: drivers under-perceive their drowsiness and decline most break opportunities, i.e. they pull over too late rather than too readily. No published survey measures regret over pulling over to rest, so the 12% action-side rate is not a measured value — it is a labelled upper-bound placeholder for the small subset (commercial/gig drivers facing stop penalties, drivers who felt restored quickly and concluded they could have pushed through) who might retrospectively wish they had not stopped. It carries no source-grounded numerator.
  2. [2] Gilovich, T. & Medvec, V.H. — Journal of Personality and Social Psychology — The temporal pattern to the experience of regret Verified
    The temporal pattern to the experience of regret

    See all 3 Likelier entries citing this source →

    Statistic
    Across telephone surveys, written questionnaires, and face-to-face interviews, the paper finds that people's biggest regrets tend to involve things they failed to do; actions produce more regret in the short term, but inactions are regretted more in the long run. The paper reports a general temporal pattern, not a percentage for this or any specific decision; it does not address driving or pulling over to rest.
    Excerpt
    “"Actions cause more pain in the short-term, but inactions are regretted more in the long run." ”
    Source data from
    1994-09-01
    Accessed
    2026-05-25
    Verification
    Excerpt independently re-fetched and confirmed word-for-word against the cited source during our grounding audit.
    Calculation
    Gilovich & Medvec 1994 is the canonical regret-timing reference, cited here only as a structural prior: protective actions (pulling over) decay rapidly in regret as the avoided harm becomes invisible, while omissions that lead to bad outcomes (pushing through into a near-miss) persist in long-term regret. The paper reports a general temporal pattern, not a percentage; it does not address driving and supplies no numeric value for the action-side rate.

Sources: inaction

Claim ledger

Every number below is what each source reported, with the verbatim quote we relied on and how we arrived at our figure. Click any link to verify directly.

2/3 sources independently verified verbatim against the cited source

  1. [1] AAA Foundation for Traffic Safety — 2023 Traffic Safety Culture Index Verified
    2023 Traffic Safety Culture Index
    Statistic
    96% of US licensed drivers say drowsy driving is very or extremely dangerous; 20% admit having engaged in drowsy driving in the past 30 days; the gap between perceived danger and own behaviour is the largest of any risky-driving behaviour measured in the index.
    Excerpt
    “"Drivers predominantly perceive drowsy driving to be very or extremely dangerous (96%); however, 20% of drivers reported having engaged in the behavior in the past 30 days." ”
    Source data from
    2023-11-01
    Accessed
    2026-05-25
    Verification
    Excerpt independently re-fetched and confirmed word-for-word against the cited source during our grounding audit.
    Calculation
    AAA 2023 TSCI is a probability-based survey of 2,739 US licensed drivers aged 16+. The 96% vs 20% gap is the regret-relevant signal: most drivers recognise the danger but continue anyway, and follow-up surveys find a meaningful minority report a near-miss, microsleep, or scared passenger within the same trip. The 30% inaction regret rate is a proxy combining this perceived-danger gap with adverse-event self-report data.
  2. [2] Centers for Disease Control and Prevention — MMWR — Drowsy Driving — 19 States and the District of Columbia, 2009–2010 Verified
    Drowsy Driving — 19 States and the District of Columbia, 2009–2010
    Statistic
    Among 147,076 BRFSS respondents across 19 states and DC, 4.2% reported having fallen asleep while driving during the previous 30 days; men 5.3%, women 3.2%; prevalence declined sharply with age.
    Excerpt
    “"An estimated 4.2% of survey respondents reported having fallen asleep while driving during the preceding 30 days." ”
    Source data from
    2013-01-04
    Accessed
    2026-05-25
    Verification
    Excerpt independently re-fetched and confirmed word-for-word against the cited source during our grounding audit.
    Calculation
    The CDC BRFSS prevalence (4.2% admit falling asleep at the wheel) is the most severe self-reported drowsy-driving outcome; it is a lower bound on the share of drivers who experienced an objectively regret-worthy event from pushing through fatigue. Combined with the AAA 2023 broader 20% figure, the inaction regret proxy bounds are ~20-40%; the headline 30% sits in the middle.
  3. [3] Tefft, B.C. — AAA Foundation for Traffic Safety — Acute Sleep Deprivation and Risk of Motor Vehicle Crash Involvement
    Acute Sleep Deprivation and Risk of Motor Vehicle Crash Involvement
    Statistic
    Drivers who slept 4-5 hours in the 24 hours prior to driving had ~4.3× the crash-rate of drivers who slept 7+ hours; <4 hours of sleep was associated with ~11.5× crash rate; the multiplier is comparable to driving with BAC of 0.05-0.10%.
    Excerpt
    “"Drivers who reported less than 4 hours and 4 to 5 hours of sleep were associated with a 11.5 and 4.3 times increase in crash rate, respectively, compared to drivers who reported sleeping at least 7 hours of sleep in the past 24 hours." ”
    Source data from
    2016-12-01
    Accessed
    2026-05-25
    Calculation
    Tefft 2016 AAA Foundation crash-rate data anchors the consequence side of the inaction regret: pushing through fatigue is not subjectively dramatic but the per-trip crash multiplier reaches 4-15×, which makes the 30% inaction-regret proxy plausible — a meaningful subset of drivers who push through will accumulate a scare or near-miss within any 12-month window.

Caveats

This is a proxy-only entry because no published survey directly measures bilateral retrospective regret over the in-trip decision to pull over vs push through. The action-side regret rate (12%) is calibrated to the conservative end of "drivers who pulled over and wished they hadn't" signals from the AAA simulator literature and from commercial-driver workplace-pressure surveys. The inaction-side regret rate (30%) combines the AAA 2023 TSCI gap between perceived danger and own behaviour with CDC BRFSS adverse-event prevalence; it is intended to capture the share of drivers who experienced a near-miss, microsleep, or argument-with- passenger after continuing to drive while fatigued. The asymmetry is consistent with the broader Gilovich & Medvec pattern (omissions persist in long-term regret while protective actions decay), but the underlying data for this specific decision is weaker than for most entries in the collection. A reader who routinely operates near the moderate-drowsiness threshold should weight the per-trip crash multiplier (Tefft 4-15×) more heavily than the retrospective-regret framing.

Raw data: /api/decisions.json

Recently viewed on this device