Evidence quality 4.63/5
Eight-dimension review score against the quality rubric . Each dimension scored 1–5.
- D1 Source grounding
- 4/5
- D2 Source authority
- 5/5
- D3 Arithmetic
- 5/5
- D4 Uncertainty
- 5/5
- D5 Scope
- 5/5
- D6 Prose
- 4/5
- D7 Perception honesty
- 4/5
- D8 Caveat completeness
- 5/5
● your factors — click this risk ▾ to reveal
- Your factors
≈ As likely as
Perceived
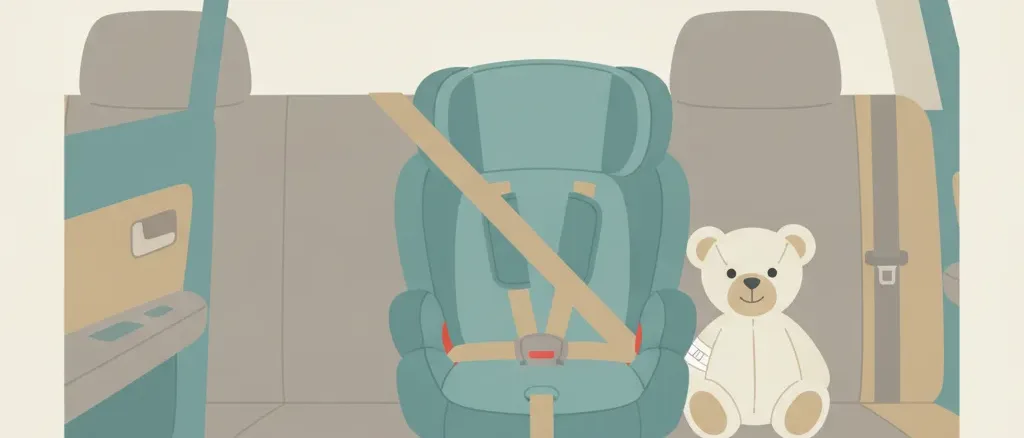
Parental fear about cars is death-framed and event-framed — the drunk driver, the catastrophic highway crash — while the ordinary injury risk of ordinary rides barely registers as a category. The extensive attention parents give to car-seat brands and installation details coexists with little sense of the base rate those seats are working against; almost no parent could say whether a child's odds of ever being hurt in a crash are one in a thousand or one in twenty. The measured answer, about one in twenty-seven through age 14, sits closer to the second guess than most would expect, even though the large majority of those injuries are minor.
Rough estimate: most parents could not place the odds within an order of magnitude; typical guesses run far below the measured ~1 in 27
Source: editorial intuition, not polled
Actual
~147,000 children (14 and younger) injured as vehicle occupants per year (US, 2023, derived)
US children 14 and younger
Show derivation
NHTSA's Children fact sheet reports an estimated 161,478 children 14 and younger injured in traffic crashes in 2023, of whom 7,081 were injured as pedestrians and 7,113 as pedalcyclists. Subtracting the two non-occupant person types leaves 147,284 — children injured while riding in vehicles, plus a small unattributed remainder of other non-occupants (skateboarders, scooter riders and similar), which is why the numerator is labeled derived. Against the same fact sheet's child population of 59,498,481 the annual rate is 147,284 / 59,498,481 ≈ 0.248% per year, about 1 in 400. Compounding over the 15 years from birth through age 14: 1 − (1 − 0.00248)^15 ≈ 0.0365, about 1 in 27. Using the full 161,478 all-person-type figure instead gives ≈ 0.040 (1 in 25), the upper end of the band; unreported injuries push higher still, while CRSS sampling error and repeat victims pull the distinct-child probability down.
Caveats: The numerator is a derivation, not a published NHTSA line item: the fact sheet's…
The numerator is a derivation, not a published NHTSA line item: the fact sheet's 161,478 all-traffic child injuries minus its named pedestrian and pedalcyclist counts, leaving mostly-but-not-only vehicle occupants. The large majority of counted injuries are minor; in the Durbin crash-involved sample only 1.6% of children had serious injuries. Police-reported CRSS estimates miss unreported injuries and carry sampling error. Compounding a single-year rate over 15 childhood years assumes 2023 rates hold and years are independent; a child injured twice counts once against the distinct-child probability. Risk is not uniform across childhood or households — restraint use, who is driving, and impairment cluster: 25% of the 1,019 children killed in 2023 died in alcohol-impaired-driving crashes, and unrestrained drivers disproportionately carry unrestrained children. The fatality-side companion levers are covered in the restraint entries.
Related risks
Other risks on similar themes — for exploring related fears.

Spaceflight (astronaut)
What are the odds of dying as an astronaut on a spaceflight mission?

Cruise ship norovirus
What are the odds of being on a cruise ship voyage that has a norovirus outbreak?

Driving on sedating meds
What are the odds of causing a fatal crash by driving while on a sedating prescription medication?




Pick challenger
The question parents actually ask — will my kid get hurt riding in the car — has a knowable answer, but it takes one subtraction to get there honestly. NHTSA counted an estimated 161,478 children 14 and younger injured in traffic crashes in 2023; that total mixes kids in cars with kids on foot and on bikes. Removing the 7,081 injured child pedestrians and 7,113 injured child pedalcyclists leaves about 147,000 injured while riding in vehicles. Against 59.5 million US children that is roughly 1 in 400 in any single year, and compounded from birth through age 14 it accumulates to about 1 in 27. The death-side companion number is far smaller: of the 1,019 child traffic deaths in 2023, 770 were vehicle occupants, which puts injured child occupants at roughly 190 for every occupant death (an injury estimate over a fatality census, so treat the ratio as an order of magnitude).
Severity context keeps the number honest. In the largest crash-involved child sample with injury grading, only 1.6% of children had serious injuries while 13.5% had minor ones — the 1-in-27 figure is dominated by bruises, belt abrasions, and whiplash-grade harm, not the catastrophic outcomes that drive parental dread. What separates the mild tail from the severe one is largely restraint quality: unrestrained children carried 3.2 times the injury odds of appropriately restrained ones, children graduated too early to adult belts carried 1.8 times, and front-row seating added another 1.4 times independent of restraint. Those are the same levers the fatality-side entries measure — Child without restraint for skipping restraints entirely, Forward-facing toddler death and Puffer jacket + car seat for the subtler misuse patterns.
The derivation cuts one corner worth naming: NHTSA publishes no single occupant-only child injury count, so the numerator here is the all-traffic total minus the two named non-occupant person types, which still includes a sliver of skateboard-and-scooter injuries. Using the raw all-traffic figure instead would say 1 in 25 — the difference between “injured in a car crash” and “injured in traffic” is about 10 percent, and conflating them is exactly the occupant-versus-all-traffic trap that child crash statistics invite. Adult odds run higher for the same reason exposure does: the all-ages companion, Car-crash injury, works out to about 1 in 137 per year against the child occupant rate of 1 in 400 — children ride fewer miles, almost never drive, and sit disproportionately in the safer rear row.
Related tidbits
US traffic crashes killed 40,901 people in 2023 and injured an estimated 2.44 million — about 60 injuries per death (NHTSA). Lifetime odds: ~1 in 105 of dying, ~1 in 2.6 of being injured; ~1 in 27 for a child riding through age 14.
Claim ledger
Every number below is what each source reported, with the verbatim quote we relied on and how we arrived at our figure. Click any link to verify directly.
-
[1] National Highway Traffic Safety Administration (NHTSA) — Traffic Safety Facts 2023 Data: Children (DOT HS 813 712)
Traffic Safety Facts 2023 Data: Children (DOT HS 813 712)See all 2 Likelier entries citing this source →
- Statistic
2023: estimated 161,478 children (14 and younger) injured in traffic crashes (442/day); 7,081 injured as pedestrians and 7,113 as pedalcyclists; child population 59,498,481; 1,019 child traffic deaths of whom 770 (76%) were occupants; 25% of child deaths in alcohol-impaired-driving crashes- Excerpt
“"For the purpose of this fact sheet, children are defined as 14 years old and younger. [...] There were 59.5 million children in the United States, 18 percent of the total U.S. population. [...] An estimated 161,478 children were injured in traffic crashes in 2023, a 3-percent increase from 156,502 in 2022. An average of 3 children were killed and an estimated 442 children were injured every day in traffic crashes in 2023. [...] Figure 1 displays the distribution of the 1,019 child traffic fatalities in 2023—76 percent (770) were occupants and 24 percent (249) were nonoccupants (pedestrians, pedalcyclists, or other nonoccupants). [...] Of the estimated 68,244 pedestrians injured in traffic crashes, 10 percent (7,081) were children. [...] Of the estimated 49,989 pedalcyclists injured in traffic crashes, 14 percent (7,113) were children." ”
- Source data from
- 2025-04-01
- Accessed
- 2026-07-26 · archived copy
- Calculation
- Occupant-side numerator derived as 161,478 − 7,081 pedestrians − 7,113 pedalcyclists = 147,284. NHTSA does not publish a single occupant-only child injury count in this fact sheet; the remainder after removing the two named non-occupant person types is dominated by vehicle occupants but includes an unquantified sliver of other non-occupants. The child population denominator (59,498,481) is the fact sheet's own Table 7 US total, sourced to the Census Bureau. Note the trap this entry is built to avoid: child traffic totals mix occupants with pedestrians and cyclists, and using the all-traffic figure for an in-the-car question overstates the occupant risk by about 10 percent.
- Independence
- Injury estimates come from NHTSA's Crash Report Sampling System (CRSS), a probability sample of police-reported crashes; fatality counts come from the FARS census; the population denominator is Census Bureau data.
-
[2] Durbin DR, Chen I, Smith R, Elliott MR, Winston FK — Pediatrics 115(3):e305-9 — Effects of seating position and appropriate restraint use on the risk of injury to children in motor vehicle crashes
Effects of seating position and appropriate restraint use on the risk of injury to children in motor vehicle crashes- Statistic
In a probability sample of 17,980 crash-involved children under 16 (representing 229,106 children), unrestrained children had OR 3.2 (95% CI 2.5-4.1) for injury vs appropriately restrained; inappropriately restrained OR 1.8 (1.4-2.3); front-seat OR 1.4 (1.2-1.7) vs rear- Excerpt
“"Inappropriately restrained children were at nearly twice the risk of injury, compared with appropriately restrained children (odds ratio [OR]: 1.8; 95% confidence interval [CI]: 1.4-2.3), whereas unrestrained children were at >3 times the risk (OR: 3.2; 95% CI: 2.5-4.1). [...] children in the front seat were at 40% greater risk of injury, compared with children in the rear seat (OR: 1.4; 95% CI: 1.2-1.7). [...] Age-appropriate restraint confers relatively more safety benefit than rear seating, but the 2 work synergistically." ”
- Source data from
- 2005-03-01
- Accessed
- 2026-07-26 · archived copy
- Calculation
- Source of all three restraint/seating multipliers. Injury basis (clinically significant injury, parent-reported on a validated instrument), per crash event, among crash-involved children under 16 in insured vehicles across 15 states, December 1998 - November 2002. Among crash-involved children in the sample, 1.6% had serious injuries and 13.5% minor injuries.
- Independence
- Insurance-claims-based probability sample (State Farm / Partners for Child Passenger Safety), a wholly different data system from NHTSA's CRSS and FARS.
-
[3] Insurance Institute for Highway Safety (IIHS) — Fatality Facts 2022: Teenagers
Fatality Facts 2022: TeenagersSee all 2 Likelier entries citing this source →
- Statistic
Per mile driven, the fatal crash rate for drivers 16-19 is just over 3 times the rate for drivers 20 and older- Excerpt
“"The fatal crash rate per miles driven for 16-19 year-olds is just over 3 times the rate for drivers ages 20 and over." ”
- Source data from
- 2024-05-01
- Accessed
- 2026-07-26 · archived copy
- Calculation
- Basis for the teen-driver multiplier: a child passenger's crash exposure scales with the per-mile crash rate of whoever is driving. Fatal-crash basis used as a conservative proxy for all-severity crash involvement.
- Independence
- IIHS rates derive from FARS counts and federal mileage surveys, independent of the CRSS injury estimates and the insurance-claims Durbin sample.