Skip to content
Likelier

Perceived fear vs. actual probability

What are the odds of serious head injury riding an e-scooter without a helmet?

Lifetime probability · activity

~22% of all e-scooter crash injuries affect the head/neck (per crash event, not per US adult)

22% lifetime chance

Most people underestimate this.

Scopes vary — shown as typical adult lifetime odds. See methodology.

Transport · reviewed 2026-06-14
Evidence quality 4.38/5

Eight-dimension review score against the quality rubric . Each dimension scored 1–5.

D1 Source grounding
4/5
D2 Source authority
5/5
D3 Arithmetic
4/5
D4 Uncertainty
5/5
D5 Scope
4/5
D6 Prose
4/5
D7 Perception honesty
4/5
D8 Caveat completeness
5/5
Average 4.38/5
Direct evidence
Source Government statistic · U.S. Consumer Product Safety Commission (CPSC)
lifetime, activity-specific each band = 10× rarer → zoomed to your factors See full scale →
certain 1 in 1K 1 in 1M 1 in 1B
1 in 1.0 1 in 15

● your factors — click this risk ▾ to reveal

  1. Your factors
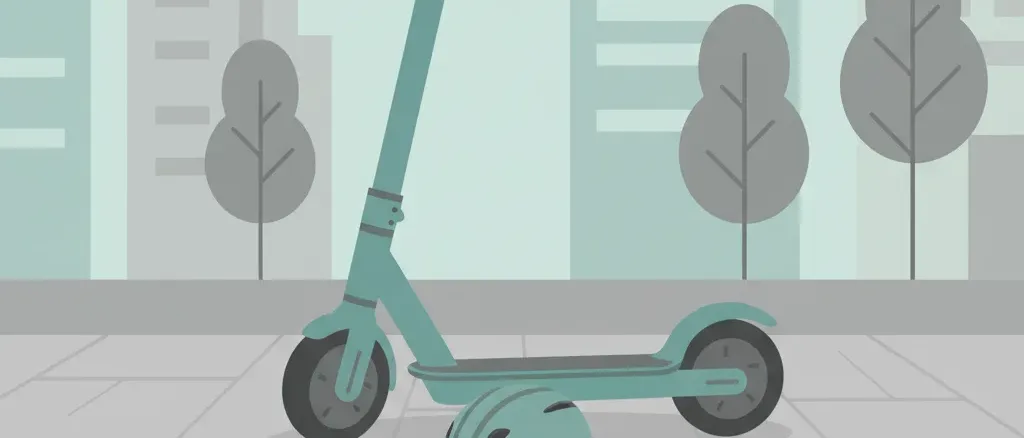
An electric scooter parked on a sidewalk next to a bicycle helmet resting on the ground, flat vector illustration in muted tones.

Perceived

E-scooter riders overwhelmingly ride bareheaded. Observational studies find that 80-96% of shared e-scooter riders skip helmets entirely, with the figure even higher in European cities where ETSC recorded just 4% helmet use among crash-involved riders. The cultural framing treats e-scooters as casual, low-speed transport -- closer to walking than cycling. Helmets feel disproportionate to the perceived risk. Many riders assume that at 15-25 km/h, a fall is unlikely to cause anything worse than scraped palms.

Rough estimate: ~2-5% chance of serious head injury per crash

Source: editorial intuition, not polled

Actual

~18-40% of e-scooter injuries involve the head or neck; unhelmeted riders face ~48-81% higher head injury risk than helmeted riders

e-scooter riders presenting to emergency departments worldwide, predominantly unhelmeted

Show derivation

A systematic review of 34 studies (PMC 2022) found 22.2% of e-scooter injuries involved the head and neck. Trauma center studies capturing more severe cases find 38-40% head involvement. We use the 22% systematic review figure as the central estimate because it pools across severity levels and geographies. This is a per-crash conditional probability: given that a rider crashes and presents to an ED, ~22% will have a head/neck injury. The vast majority of these riders (~80-96%) were unhelmeted. In a controlled bicycle-collision cohort (the closest robust helmet-effect benchmark, since e-scooter helmet series are too small for odds ratios), helmet use reduced head injury odds by 48% (OR 0.52, 95% CI 0.31-0.86) and high-energy head trauma odds by 72% (OR 0.28). In one community ED study, 100% of TBI and closed head injuries occurred in unhelmeted patients. The annual crash risk per rider is harder to estimate due to unknown rider-miles; with on the order of tens of thousands of US e-scooter ED visits per year (the JAMA NEISS pull below puts the 2022 figure at 56,847) against an estimated 40-50 million US e-scooter trips/year, the per-trip ER visit rate is roughly 0.1-0.3%, but many crashes go unreported. 2026 refresh: a NEISS analysis in JAMA Network Open (Fernandez et al. 2024) puts US e-scooter ED injuries at 8,566 in 2017 rising to 56,847 in 2022 (>45%/yr) -- an independent confirmation of the adoption-driven surge that does not move the 22% per-crash head/neck central estimate. The CDC / Austin Public Health field study (2018-19) found ~48% head injury, ~15% TBI, and <1% helmet use among injured dockless riders, with 33% on their first ride -- consistent with our unhelmeted-baseline framing and inside the 0.15-0.40 band. The point estimate, log_value, and uncertainty are unchanged; the new sources refresh incidence context and reinforce the helmet effect size rather than revise the headline number.

Caveats: The 22% head injury rate is conditional on presenting to an ED after a crash, no…

The 22% head injury rate is conditional on presenting to an ED after a crash, not a per-trip probability. Many minor crashes (scrapes, bruises) never reach a hospital. The unhelmeted rider population dominates the data (80-96% of riders), so the baseline head injury rate effectively IS the unhelmeted rate. True per-trip risk is hard to estimate because total trip counts are uncertain. The CPSC ED visit figures use NEISS projections that carry sampling uncertainty. E-scooter injury epidemiology is a rapidly evolving field -- adoption is growing faster than the evidence base, and most studies cover 2018-2023 data from early-adoption cities. The CDC / Austin study's ~48% head-injury and ~15% TBI shares come from a severe-presentation cohort (EMS/ED) and run higher than the 22% global systematic-review pool; both are conditional on a crash reaching care, not per-trip rates. The drug-use and alcohol odds ratios from the JAMA NEISS study describe hospitalization odds given an injury across pooled micromobility vehicles, so they are approximate when applied to e-scooter head injury specifically.

Related risks

Other risks on similar themes — for exploring related fears.

Transport

E-scooter injury

What are the odds of serious injury riding an electric scooter?

Transport

E-bike no helmet

What are the odds of serious head injury riding an e-bike without a helmet?

Transport

Mishandled luggage

What are the odds of an airline losing or mishandling checked luggage?

Transport

Flight cancellation

What are the odds of having a flight canceled on any given trip?

Transport

At-fault injury crash

What are the odds of causing an injury crash as an at-fault driver?

Transport

Car-crash injury

What are the odds of being injured in a car crash?

Transport

Deer collision

What are the odds of hitting a deer or other animal with your car?

Transport

Trip disruption: war or disaster

What are the odds of a trip being significantly disrupted by war, political unrest, or natural disaster?

Compare to:

A systematic review of 34 studies found that 22% of all e-scooter crash injuries involve the head and neck, with 2.5% meeting criteria for traumatic brain injury and another 1.9% involving intracranial hemorrhage. The CPSC estimated roughly 169,300 e-scooter emergency-department injuries in the US over 2017-2022, with the 2022 estimate (51,700) running 22% above 2021 — a steep climb that tracks the explosive adoption curve rather than any increase in per-trip risk.

The helmet data is stark. The largest controlled study of helmet use in comparable pavement-fall collisions found that wearing a helmet cut head injury odds nearly in half (OR 0.52), and for high-energy crashes the reduction reached 72% (OR 0.28). That study tracked bicyclists rather than scooter riders — dedicated e-scooter helmet series are too small to yield reliable odds ratios — but the forward-fall, head-to-pavement mechanism is closely comparable. In one community ED study, every single TBI and closed head injury occurred in an unhelmeted patient. Finite-element simulations of unhelmeted e-scooter falls at Imperial College London found that cutting rider speed from 30 km/h to 20 km/h reduced impact speed by only 14% and impact force by only 12% — falls at every tested speed still crossed the threshold for skull fracture, with head-to-ground impact speeds comparable to those used to certify bicycle helmets. Yet observational studies consistently find that 80-96% of shared e-scooter riders skip helmets.

The disconnect is cultural, not informational. E-scooters occupy a perceptual category closer to walking than to cycling, despite operating at speeds of 15-25 km/h where the head-to-pavement energy transfer is biomechanically identical to a bicycle crash. The standing riding position actually concentrates fall risk on the head: unlike a cyclist who may roll or use the bicycle frame to absorb energy, a scooter rider in a sudden stop pitches forward from a high center of gravity directly onto the pavement.

Across 34 studies, ~22% of e-scooter crash injuries involve the head or neck, and most of those riders were bareheaded. Helmets cut head-injury odds by roughly half, yet 80-96% of shared-scooter riders skip them.

Claim ledger

Every number below is what each source reported, with the verbatim quote we relied on and how we arrived at our figure. Click any link to verify directly.

2/5 sources independently verified verbatim against the cited source

  1. [1] Bone & Joint Open (British Editorial Society of Bone and Joint Surgery) — The impact of e-scooter injuries: a systematic review of 34 studies
    The impact of e-scooter injuries: a systematic review of 34 studies
    Statistic
    22.2% of e-scooter injuries were head and neck injuries across 34 studies; TBI in 2.5%, intracranial hemorrhage in 1.9%, concussions in 3.2%
    Excerpt
    “"Head and neck injuries accounted for 22.2% of all reported e-scooter injuries across 34 studies. Traumatic brain injury composed 2.5%, intracranial hemorrhage 1.9%, and concussions 3.2% of all injuries in overwhelmingly unhelmeted populations." ”
    Source data from
    2022-10-01
    Accessed
    2026-04-24 · archived copy
    Calculation
    Systematic review pooling 34 studies on e-scooter injuries globally. The 22.2% head/neck figure is the weighted proportion across all injury presentations. Most study populations had <20% helmet use. The TBI subcomponents (2.5% TBI, 1.9% ICH, 3.2% concussion) total ~7.6% of all injuries being brain-specific, with the remainder being facial fractures, lacerations, and soft tissue injuries.
  2. [2] Traffic Injury Prevention (Taylor & Francis) — Head injuries related to bicycle collisions and helmet use - an observational study Verified
    Head injuries related to bicycle collisions and helmet use - an observational study
    Statistic
    Helmet use reduced head injury odds ratio to 0.52 (95% CI 0.31-0.86); in high-energy trauma, OR was 0.28 (95% CI 0.12-0.80) -- bicycle-collision cohort, applied here as the closest helmet-effect benchmark for unprotected scooter-type falls
    Excerpt
    “"Helmet use reduced the risk of head injury with an odds ratio of 0.52, (95% CI 0.31 - 0.86). In high-energy trauma, the use of a helmet showed a significant reduction in the risk of sustaining a head injury with an odds ratio of 0.28, (95% CI 0.12 - 0.80)." ”
    Source data from
    2024-06-21
    Accessed
    2026-06-30 · archived copy
    Verification
    Excerpt independently re-fetched and confirmed word-for-word against the cited source during our grounding audit.
    Calculation
    An observational study of 407 bicyclists assessed by Copenhagen Emergency Medical Services (2016-2019), of whom 247 (61%) sustained a head injury. The OR of 0.52 means helmeted riders had roughly half the head injury risk of unhelmeted riders; for high-energy crashes the OR of 0.28 means helmets reduced head injury risk by 72%. These are bicycle-collision figures. Dedicated e-scooter helmet-effect studies are smaller and rarely report odds ratios (the largest e-scooter helmet series had only one helmeted rider out of 92), so the bicycle benchmark is the closest robust helmet-effect estimate; the head-to-pavement biomechanics of a forward fall are comparable between the two modes, but the cross-mode transfer is an approximation.
  3. [3] U.S. Consumer Product Safety Commission (CPSC) — Micromobility Products-Related Deaths, Injuries, and Hazard Patterns, 2017-2023
    Micromobility Products-Related Deaths, Injuries, and Hazard Patterns, 2017-2023

    See all 2 Likelier entries citing this source →

    Statistic
    233 micromobility deaths 2017-2022, of which 111 (48%) were e-scooter fatalities; ~169,300 e-scooter ED-treated injuries 2017-2022; the 2022 e-scooter ED estimate of 51,700 was a 22% increase over 2021
    Excerpt
    “"CPSC identified 233 fatalities involving micromobility products from 2017 to 2022. E-scooter-related fatalities represent 111 out of 233 (48 percent) total fatalities. Staff estimates that 169,300 injuries related to e-scooters were treated from 2017 through 2022. The 2022 ED-treated injury estimate of 51,700 for e-scooters reflects an increase of 22 percent from the 2021 estimate, which is statistically significant (p-value < 0.01)." ”
    Source data from
    2024-06-01
    Accessed
    2026-06-30 · archived copy
    Calculation
    111 e-scooter deaths over 6 years = ~18.5 per year nationally. With estimated 40-50 million annual e-scooter trips in the US, the per-trip fatality rate is roughly 1 in 2-3 million trips. E-scooter ED-treated injuries rose steadily across 2017-2022 to a 2022 estimate of 51,700 (a statistically significant 22% increase over 2021), reflecting explosive adoption rather than increasing per-trip risk. The ~115,713 figure previously attributed here to a 2024 NEISS total is not in this 2017-2022 report and has been removed; the headline 22% head/neck share comes from the systematic-review source above, not from this CPSC report.
  4. [4] JAMA Network Open — Injuries With Electric vs Conventional Scooters and Bicycles Verified
    Injuries With Electric vs Conventional Scooters and Bicycles
    Statistic
    e-Scooter ED injuries rose from 8,566 (2017) to 56,847 (2022), >45% annually; head injury associated with hospitalization (AOR 1.20), drug use (AOR 2.70), alcohol use (AOR 1.71)
    Excerpt
    “"e-Scooter injuries increased by more than 45% annually (P = .002), from 8566 (95% CI, 5522-11 611) to 56 847 (95% CI, 39 673-74 022). Head injury (AOR, 1.20; 95% CI, 1.03-1.41), drug use (AOR, 2.70; 95% CI, 2.26-3.23), and alcohol use (AOR, 1.71; 95% CI, 1.37-2.13) at the time of vehicle injury were each associated with hospitalization among all vehicle types." ”
    Source data from
    2024-07-01
    Accessed
    2026-06-14 · archived copy
    Verification
    Excerpt independently re-fetched and confirmed word-for-word against the cited source during our grounding audit.
    Calculation
    National Electronic Injury Surveillance System (NEISS) analysis of US ED visits 2017-2022. The 8,566-to-56,847 trajectory (a 6.6-fold rise over 5 years) confirms the CPSC adoption-driven surge from an independent NEISS pull. The drug-use AOR of 2.70 for hospitalization is the clean, vehicle-pooled multiplier added as a personal factor below; it is a distinct axis from the alcohol AOR (1.71) and the head-injury-to-hospitalization escalation (1.20). These are hospitalization odds conditional on an injury, not per-trip risks.
  5. [5] Centers for Disease Control and Prevention / Austin Public Health — Dockless Electric Scooter-Related Injuries Study (CDC / Austin Public Health)
    Dockless Electric Scooter-Related Injuries Study (CDC / Austin Public Health)
    Statistic
    Of 190 injured dockless e-scooter riders (125 interviewed), ~48% had a head injury, ~15% had injuries suggestive of TBI, and <1% wore a helmet; 33% were first-time riders
    Excerpt
    “"Nearly half (48%) of injured riders had a head injury. About 15% had evidence suggestive of a traumatic brain injury. Less than 1% of injured riders were wearing a helmet at the time of their injury. Roughly one-third (33%) were first-time e-scooter riders." ”
    Source data from
    2019-05-02
    Accessed
    2026-06-14 · archived copy
    Calculation
    First US public-health agency field study of dockless shared e-scooters (Austin, TX, Sep-Nov 2018). The <1% observed helmet rate anchors the "unhelmeted baseline IS the headline rate" framing. The 48% head-injury share is higher than the 22% systematic-review pool because this cohort skews toward more severe ED/EMS presentations; the 15% TBI rate sits well inside our 0.15-0.40 uncertainty band. Excerpt paraphrased from agency findings as reported by Consumer Reports and the CDC MMWR summary; figures cross-checked against multiple reports of the same study.

434 risks with measured probability
1 in 10 1 in 100 1 in 1K 1 in 10K 1 in 100K 1 in 1M 1 in 10M 1 in 100M 1 in 1B certain rarer → Cosmetic surgery abroad risk — 1 in 10 Infant sugar/salt and adult disease — 1 in 10 Endometriosis — 1 in 10 Hair transplant Turkey risk — 1 in 10 Knee replacement — 1 in 10 Chronic painkillers — 1 in 10 Complete tooth loss — 1 in 9.1 Alzheimer's — 1 in 8.3 Sleep deprivation — 1 in 8.3 Smokeless tobacco — 1 in 8.3 Cycling w/o helmet — 1 in 8.0 Bruxism tooth damage — 1 in 7.7 Skipping care over ICE fear — 1 in 7.1 Vision loss — 1 in 6.7 Hernia from lifting — 1 in 6.7 Hip fracture risk — 1 in 6.7 Regular drinking — 1 in 6.7 First heart attack — 1 in 5.9 Infertility — 1 in 5.7 5+ years paid LTC — 1 in 5.6 CTE (football) — 1 in 5.0 Major depression — 1 in 4.9 Hiking injury — 1 in 4.8 Infection from sharing food with child — 1 in 4.2 Lyme disease — 1 in 4.0 Loneliness & health — 1 in 3.8 Inheriting AUD risk — 1 in 3.5 Alcohol use disorder — 1 in 3.4 Anxiety disorder — 1 in 3.2 Menopause CV risk acceleration — 1 in 3.0 Silent diabetes — 1 in 3.0 Flying with cold — 1 in 2.9 Job loss & depression — 1 in 2.9 Tick illness (forest) — 1 in 2.9 Silent high cholesterol — 1 in 2.9 Grandparent loss in childhood — 1 in 2.8 Pacifier floor drop — 1 in 2.8 Silent hypertension — 1 in 2.7 Drug-resistant infection — 1 in 2.6 No marrow match — 1 in 2.4 Nursing home admission — 1 in 2.2 False-positive mammogram — 1 in 2.0 Regular smoking — 1 in 2.0 Travelers' diarrhea — 1 in 2.0 Adventure sports — 1 in 1.8 LTC need after 65 — 1 in 1.8 Widowhood probability — 1 in 1.7 Unprotected sex — 1 in 1.5 Chronic back pain — 1 in 1.3 Hand hygiene — 1 in 1.0 Cancer (any) — 1 in 7.1 E-scooter no helmet — 1 in 4.5 E-bike no helmet — 1 in 4.0 Mishandled luggage — 1 in 3.7 At-fault injury crash — 1 in 2.9 Deer collision — 1 in 2.7 Car-crash injury — 1 in 2.6 Flight cancellation — 1 in 1.8 Trip disruption: war or disaster — 1 in 1.7 Home burglary (global) — 1 in 9.1 Hitchhiking assault — 1 in 8.8 Mail check fraud — 1 in 7.7 Child sexual abuse — 1 in 6.8 Stalking — 1 in 6.2 Student sexual assault — 1 in 5.7 Domestic violence — 1 in 3.7 Night walk assault — 1 in 3.6 Bicycle theft — 1 in 2.9 Sexual assault — 1 in 2.3 Sexual harassment (lifetime) — 1 in 1.6 Water scarcity — 1 in 2.5 Carrington-class solar storm — 1 in 1.9 WAIS tipping point — 1 in 1.1 Indoor cat escape harm — 1 in 10 Off-leash dog bite — 1 in 9.8 Rabbit dies in 4 years — 1 in 3.3 Dog bite (non-fatal) — 1 in 1.8 Hamster dies before teenager — 1 in 1.0 Iron gap (women) — 1 in 3.9 Vitamin D gap — 1 in 2.9 Magnesium gap — 1 in 1.9 Undercooked food — 1 in 1.6 Raw meat cross-contamination — 1 in 1.4 Food left out — 1 in 1.2 AI voice scam — 1 in 2.9 Online scam loss — 1 in 2.5 Teen cyberbullying — 1 in 2.0 Kids & explicit content — 1 in 1.9 Data breach — 1 in 1.1 Miscarriage — 1 in 6.7 Teen suicide attempt — 1 in 5.6 Postpartum depression — 1 in 4.8 Painkiller before infant vaccination — 1 in 3.8 Excessive pregnancy weight — 1 in 2.6 Unvaxxed child & measles — 1 in 2.0 Child head lice — 1 in 2.0 Elder fraud loss — 1 in 10 Pension fund collapse — 1 in 10 Housing crash — 1 in 8.3 IRS audit — 1 in 6.7 Currency collapse — 1 in 5.6 Visa overstay deportation — 1 in 5.6 Subprime auto-loan repossession — 1 in 5.0 Long term disability working age — 1 in 4.0 Student loan default — 1 in 3.8 Whistleblower retaliation — 1 in 3.2 Forced job exit before retirement — 1 in 2.9 Retirement shortfall — 1 in 2.6 BNPL missed payment — 1 in 2.4 Divorce — 1 in 2.4 Burst pipe damage — 1 in 2.2 Workplace bullying — 1 in 2.1 Prolonged grid blackout — 1 in 2.0 Deportation (undocumented) — 1 in 1.8 Funeral cost shock — 1 in 1.7 Identity theft — 1 in 1.7 Credit card fraud — 1 in 1.5 School bullying — 1 in 1.5 Frontline soldier casualty — 1 in 1.3 Economic recession — 1 in 1.0 Stock market crash — 1 in 1.0 Hail roof damage — 1 in 3.0 Problem-tenant loss — 1 in 1.8 LASIK complications — 1 in 100 Dry toilet paper harm — 1 in 100 Secondhand smoke — 1 in 91 Gaming disorder (adults) — 1 in 83 High-heel ER visit — 1 in 79 Child throwing object — 1 in 67 Medication reaction — 1 in 58 Drug overdose — 1 in 56 Gas-stove asthma in a child — 1 in 50 Cat litter toxoplasmosis — 1 in 48 Mental health LTD claim — 1 in 45 Benzo dependence — 1 in 40 Tap water lead — 1 in 40 Medication misuse — 1 in 35 Traumatic brain injury — 1 in 33 Hospital infection — 1 in 31 Air pollution — 1 in 29 End-stage kidney disease — 1 in 29 Traveler's diarrhea (water) — 1 in 26 Skiing injury — 1 in 26 Bipolar disorder — 1 in 23 Wisdom-tooth surgery — 1 in 22 Dental tourism complication — 1 in 20 Elderly abandonment — 1 in 20 Parkinson's — 1 in 20 Pet parasites — 1 in 20 Undiagnosed ADHD — 1 in 20 Adult-onset food allergy — 1 in 19 Non-Alzheimer's dementia — 1 in 17 Cannabis use disorder — 1 in 16 Stroke — 1 in 15 PTSD — 1 in 15 Severe hearing loss — 1 in 14 Type 2 diabetes — 1 in 13 Appendicitis — 1 in 13 Indoor cooking smoke — 1 in 13 Untreated depression — 1 in 13 Soda and diabetes — 1 in 13 Heart disease — 1 in 12 Medical error death — 1 in 12 Compulsive sexual behavior — 1 in 12 Eating disorder — 1 in 11 Hip replacement — 1 in 11 Kidney stones — 1 in 11 Parent death/disability — 1 in 11 Sedentary lifestyle — 1 in 11 Salon infection — 1 in 11 Ovarian cancer — 1 in 91 Colorectal cancer — 1 in 77 Breast cancer — 1 in 59 Liver cancer — 1 in 59 Lung cancer — 1 in 56 Prostate cancer — 1 in 50 Melanoma (UV) — 1 in 29 Low-fiber CRC risk — 1 in 26 Red meat & CRC — 1 in 21 Charred meat & cancer — 1 in 20 Maintenance crash — 1 in 83 Driving on sedating meds — 1 in 77 Texting + driving — 1 in 56 Unbelted crash death — 1 in 53 Speeding 20% over limit — 1 in 50 Motorcycle no helmet — 1 in 45 Spaceflight (astronaut) — 1 in 42 Video watching + driving — 1 in 32 Child crash injury — 1 in 27 Drowsy driving — 1 in 26 Cruise ship norovirus — 1 in 24 E-scooter injury — 1 in 10 Pickpocketed while traveling — 1 in 38 Catalytic converter theft — 1 in 37 Knife-involved assault — 1 in 37 Vehicle theft — 1 in 34 Street robbery / mugging — 1 in 26 Wrongful conviction — 1 in 24 Drink spiking — 1 in 17 Keyless relay car theft — 1 in 13 Protest under autocracy — 1 in 12 AMOC collapse — 1 in 20 Sting anaphylaxis — 1 in 50 Cat collar injury — 1 in 25 Restaurant food poisoning — 1 in 58 B12 deficiency — 1 in 28 Vegetarian deficiency — 1 in 14 Intimate deepfake — 1 in 25 Social media problematic use — 1 in 13 Child swallows object (ER) — 1 in 91 Life-threatening birth (US) — 1 in 61 Childbirth death (SSA) — 1 in 55 Toddler stair fall — 1 in 37 Co-sleeping death — 1 in 36 Play swing & slide injury — 1 in 33 Autism diagnosis — 1 in 31 C-section complications — 1 in 29 Toy injury requiring ER (child) — 1 in 21 Preeclampsia — 1 in 20 Severe birth tearing — 1 in 17 Gestational diabetes — 1 in 13 Child fall head injury — 1 in 12 Dying without heir — 1 in 100 Sports betting financial ruin — 1 in 100 Fighter pilot death — 1 in 48 Commercial fishing career death — 1 in 45 Logging career death — 1 in 34 Medical bankruptcy — 1 in 25 Compulsive buying disorder — 1 in 20 Rental listing scam loss — 1 in 20 Losing SNAP under 2025 work rules — 1 in 18 Mortgage foreclosure — 1 in 14 Musculoskeletal LTD claim — 1 in 14 Day-trading losses — 1 in 13 Extremist govt catastrophe — 1 in 13 Hurricane home destruction — 1 in 17 NAION (Ozempic) — 1 in 909 Infant pool submersion — 1 in 800 MS — 1 in 769 Workplace fatality — 1 in 690 Typhoid fever — 1 in 654 GLP-1 anesthesia aspiration — 1 in 613 Unsafe imported products — 1 in 565 Brain aneurysm — 1 in 400 COVID-19 — 1 in 400 Fireworks injury — 1 in 385 Too much caffeine — 1 in 366 Sickle cell disease — 1 in 365 Counterfeit medicine — 1 in 361 Spinal cord injury — 1 in 313 Childhood cancer diagnosis — 1 in 285 Next pandemic death — 1 in 208 Dengue (travel) — 1 in 200 Heat-triggered preterm birth — 1 in 200 Skipping daily showers — 1 in 200 Not scrubbing feet — 1 in 200 Marrow donation risk — 1 in 167 Tick-borne encephalitis — 1 in 167 Schizophrenia — 1 in 143 Accidental fall — 1 in 135 Sudden death during exercise — 1 in 123 Suicide (US) — 1 in 121 Opioid addiction — 1 in 114 Tuberculosis (global) — 1 in 109 HIV diagnosis — 1 in 105 Radon cancer — 1 in 435 Testicular cancer — 1 in 250 Cervical cancer — 1 in 167 Pancreatic cancer — 1 in 125 Pedestrian death — 1 in 806 Motorcycle crash — 1 in 709 Boating drowning — 1 in 685 Driver kills pedestrian — 1 in 552 Phone-distracted walking injury — 1 in 400 EV battery fire — 1 in 333 Cyclist killed by car — 1 in 159 Petrol car fire — 1 in 125 Self-driving car fatality — 1 in 115 Car crash — 1 in 105 Firefighter duty death — 1 in 455 Police duty death — 1 in 357 Homicide — 1 in 339 Pig-butchering scam — 1 in 106 Extreme heat — 1 in 333 Climate change death — 1 in 204 Bat bite & rabies — 1 in 278 Mosquito-borne disease — 1 in 190 Food poisoning (global) — 1 in 317 Solar panel fire — 1 in 667 Untreated childhood scoliosis — 1 in 1,000 Child window fall — 1 in 855 Walker stair fall — 1 in 625 Infant fall — 1 in 500 Baby walker injury — 1 in 455 Maternal mortality — 1 in 272 Maternal age & birth defects — 1 in 200 Child death (<18) — 1 in 103 Caving career death — 1 in 167 EMS duty death — 1 in 909 Civilian war casualty — 1 in 499 Soldier in combat — 1 in 270 Student visa revocation — 1 in 263 Mining career death — 1 in 214 Gambling financial ruin — 1 in 159 Lightning home fire — 1 in 461 Wildfire home destruction — 1 in 120 Malaria (travel) — 1 in 10,000 Infection from shared drink — 1 in 10,000 Chagas disease — 1 in 8,475 Wild berry fox tapeworm — 1 in 8,475 Child nicotine-pouch ingestion — 1 in 7,937 Schistosomiasis death — 1 in 6,667 Sudden death (young adult) — 1 in 3,922 Unsafe wiring — 1 in 3,390 Sepsis from wound — 1 in 2,857 Anesthesia awareness — 1 in 2,500 Heat stroke (outdoor) — 1 in 1,905 House fire — 1 in 1,818 Rabies from dogs — 1 in 1,449 Drowning — 1 in 1,379 Shallow-water diving SCI — 1 in 1,111 Choking — 1 in 1,099 EVALI vaping hospitalization — 1 in 1,064 Betel nut cancer — 1 in 1,290 Blood clot (flight) — 1 in 4,651 Killing a cyclist — 1 in 3,937 Teen road-crash death — 1 in 3,030 Child rear bike seat — 1 in 2,500 Child without restraint — 1 in 2,000 Fatal police encounter — 1 in 4,739 Honor killing — 1 in 2,381 Intimate-partner homicide — 1 in 1,767 Hurricane — 1 in 8,929 Drought famine death — 1 in 6,536 Blizzard death — 1 in 4,367 Earthquake — 1 in 3,802 Listeria from deli meat — 1 in 6,061 Serious E. coli from fresh produce — 1 in 4,831 Food poisoning (US) — 1 in 1,862 Fish mercury — 1 in 1,695 Fish bone injury — 1 in 1,429 Phone/laptop battery fire — 1 in 4,545 Laundry pod ingestion — 1 in 6,494 Pool drowning — 1 in 5,882 Untreated infant hip dysplasia — 1 in 5,000 SIDS — 1 in 2,398 War (civilian) — 1 in 2,000 Flu brain swelling in a child (IAE/ANE) — 1 in 100,000 Fatal bee/wasp sting — 1 in 76,923 Locally-acquired dengue (continental US) — 1 in 66,667 Anesthesia death — 1 in 45,662 Dog hot car death — 1 in 41,667 Vibrio vulnificus wound infection — 1 in 32,051 Anaphylaxis — 1 in 27,548 Chiropractic neck manipulation — 1 in 16,667 CO poisoning — 1 in 14,006 Hepatitis A (travel) — 1 in 12,500 Skipping allergy immunotherapy — 1 in 11,111 Acrylamide & cancer — 1 in 16,667 Bus crash — 1 in 100,000 Plane crash — 1 in 58,824 Post-crash car fire — 1 in 25,000 Railroad crossing death — 1 in 20,576 Car submersion — 1 in 16,667 Child bike trailer — 1 in 14,286 Runway near-miss — 1 in 13,699 Acid attack — 1 in 94,340 Terrorism — 1 in 77,519 Child stranger abduction — 1 in 38,760 Stranger kidnapping — 1 in 35,211 Dowry death — 1 in 13,158 Accidental gun death — 1 in 11,299 Wildfire — 1 in 100,000 Tornado — 1 in 80,645 Tsunami — 1 in 52,632 Ocean drowning — 1 in 29,155 Flood — 1 in 20,202 Post-hurricane heat death — 1 in 20,000 Landslide death — 1 in 18,416 Supervolcano eruption — 1 in 12,376 Bee sting — 1 in 78,927 Swallowed bee/wasp — 1 in 29,155 Fatal scorpion sting — 1 in 26,110 Dog chocolate death — 1 in 13,889 Lead-tainted cinnamon pouch — 1 in 40,000 Plastic container leaching — 1 in 16,949 Infant car-seat asphyxia — 1 in 64,935 Bouncer chair fall — 1 in 60,606 Toddler choking — 1 in 50,000 Unsupervised infant choking — 1 in 50,000 Forward-facing toddler death — 1 in 26,738 Magnet ingestion — 1 in 12,048 Snorkeling death — 1 in 21,739 Pet in transport — 1 in 20,000 Death in ICE custody — 1 in 17,065 Landmine or UXO injury — 1 in 14,728 Vaccine reaction — 1 in 763,359 Aluminum & Alzheimer's — 1 in 169,492 Residential gas leak — 1 in 140,845 Child hot car death — 1 in 102,041 Glyphosate & cancer — 1 in 1,000,000 Teflon cookware cancer — 1 in 169,492 Roller coaster injury — 1 in 312,500 Ferry sinking — 1 in 133,333 Turbulence injury — 1 in 114,943 School shooting — 1 in 192,308 Mass shooting — 1 in 113,636 Avalanche — 1 in 210,526 Lightning — 1 in 209,205 Snake bite — 1 in 884,956 Spider bite — 1 in 833,333 Hippo attack — 1 in 564,972 Crocodile attack — 1 in 337,838 Dog bite — 1 in 142,045 Pesticide residue — 1 in 1,000,000 Dirty can illness — 1 in 200,000 PLA bioplastic harm — 1 in 169,492 Infant swing death — 1 in 714,286 Whole-grape choking — 1 in 625,000 Child blind cord strangulation — 1 in 416,667 Child plastic bag suffocation — 1 in 263,158 Button battery — 1 in 250,000 Inclined sleeper death — 1 in 238,095 Elevator/escalator death — 1 in 188,324 Japanese encephalitis (travel) — 1 in 2,000,000 Kid + front airbag — 1 in 10,000,000 Asteroid impact — 1 in 1,351,351 Banana spider eggs — 1 in 10,000,000 Shark attack — 1 in 5,681,818 Bear attack — 1 in 3,787,879 Wild berry poisoning — 1 in 2,222,222 Piranha attack — 1 in 135,135,135 Phone at gas pump — 1 in 1,000,000,000 Phone on plane — 1 in 1,000,000,000
Lottery jackpot 1 in 95,238

Recently viewed on this device