Evidence quality 4.63/5
Eight-dimension review score against the quality rubric . Each dimension scored 1–5.
- D1 Source grounding
- 4/5
- D2 Source authority
- 5/5
- D3 Arithmetic
- 5/5
- D4 Uncertainty
- 4/5
- D5 Scope
- 5/5
- D6 Prose
- 5/5
- D7 Perception honesty
- 4/5
- D8 Caveat completeness
- 5/5
● your factors — click this risk ▾ to reveal
- Your factors
≈ As likely as
Perceived
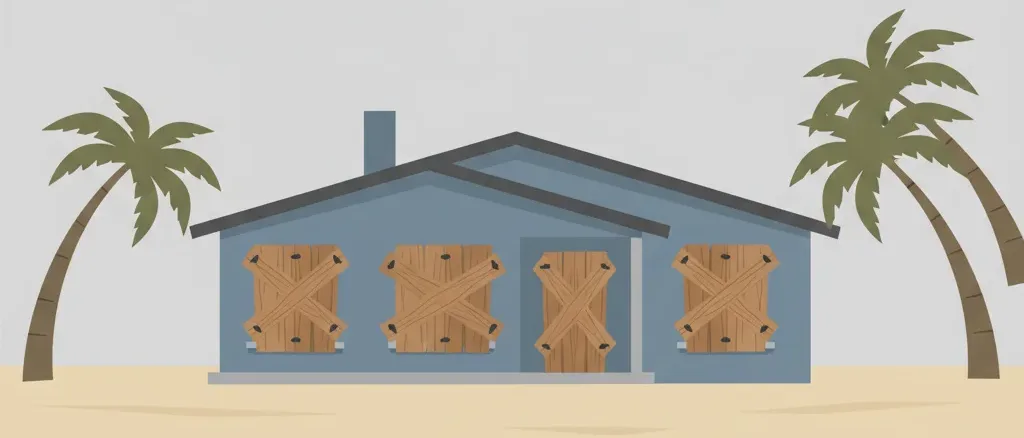
Awareness of hurricane risk among Gulf Coast and Atlantic coastal homeowners is generally high — the subject dominates local news each hurricane season, and insurance markets have made the risk increasingly salient through premium increases and non-renewals. No formal national survey specifically elicits perceived probability of total home destruction (as distinct from flooding or wind damage) from a hurricane over a homeownership period. Coastal residents tend to be reasonably aware of annual storm probability but often underestimate the conditional probability that a direct hit results in complete structural loss versus repairable damage.
Rough estimate: coastal homeowners know a strike is plausible; few expect complete destruction
Source: editorial intuition, not polled
Actual
~5% annual probability of a major hurricane (Cat 3+) passing within 50 nm — NOAA's 20-year major-hurricane return-period example
US Gulf/Atlantic Coast location with NOAA's example 20-year major-hurricane return period
Show derivation
Two probabilities are combined: (1) the annual probability that a major hurricane passes within destructive range of the home, and (2) the conditional probability that such a storm destroys the structure. Only the first term is directly source-stated; the second is an engineering estimate flagged as such below. (1) Strike probability (SOURCE-STATED): NOAA's National Hurricane Center defines the hurricane return period as the frequency at which a storm passes within 50 nautical miles of a location, and gives the worked example that "a return period of 20 years for a major hurricane means that on average during the previous 100 years, a Category 3 or stronger hurricane passed within 50 nautical miles of that location about five times" — i.e. an annual major-hurricane strike probability of 5%. This entry uses that stated 5%/yr figure for an active Gulf/Atlantic location. (NOAA also states the highest-frequency locations see a hurricane of ANY category every 5-7 years; the destruction step below is conditioned on a MAJOR strike, so the major-hurricane return period is the relevant term.) (2) Conditional destruction rate (ESTIMATE — NOT source-stated): no cited source states a per-home total-loss rate given a major direct hit. Post-storm reporting on Hurricane Ian (2022, Cat 4) indicates on the order of a percent of a whole direct-path county's housing stock was total-loss, with near-total loss concentrated within 1-2 miles of the track; this entry adopts a conservative ~4% conditional total-loss rate for the broader 50-nm exposure zone as an order-of-magnitude engineering estimate, not a figure any cited source publishes. Annual P(destruction) = P(major strike) × P(destroyed | major strike) = 0.05 × 0.04 ≈ 0.002 (0.2%/yr) Over a 30-year ownership horizon: 1 − (1 − 0.002)^30 ≈ 0.059 (5.9%, ~1 in 17). Sensitivity: raising the conditional rate to 8% roughly doubles the headline (~0.11, ~1 in 9); the wide uncertainty band [1%, 18%] reflects that the conditional term is not source-pinned.
Caveats: This entry applies to US Gulf and active Atlantic coastal homeowners — roughly t…
This entry applies to US Gulf and active Atlantic coastal homeowners — roughly the subset of ~8-10 million housing units in the highest-frequency hurricane exposure zones. The probability calculation requires two uncertain inputs: the annual strike probability (which varies enormously by precise location along the coast) and the conditional destruction rate (which varies by storm intensity, building type, and elevation). The central estimate of 5.9% (1 in 17) over 30 years reflects a mid-Gulf-Coast active location with site-built construction; high-exposure locations (near-shore SE Louisiana, SW Florida) combined with manufactured housing or storm-surge exposure could yield 10-30× higher probabilities. The entry covers wind and surge destruction together; flood insurance is separate from standard homeowners policies in the US (NFIP), so the financial exposure to storm surge is often uninsured or underinsured even when the physical destruction risk is high. This is not a mortality entry — the separately maintained hurricane-death entry covers fatality risk.
Related risks
Other risks on similar themes — for exploring related fears.

Wildfire home destruction
What are the odds that wildfire will destroy a home in the wildland-urban interface?
Hail roof damage
What are the odds that hail will seriously damage your roof during your lifetime?



Toy injury requiring ER (child)
What are the odds of a child needing an ER visit for a toy-related injury?

Cat litter toxoplasmosis
What are the odds of acquiring a toxoplasma infection from cleaning a cat's litter box?

Rental listing scam loss
How likely is a first-time renter to lose money to a fake-listing scam?
Pick challenger
Hurricane total home destruction requires two separate events to coincide: a major storm must pass close enough to cause catastrophic winds or surge, and the home must be in the portion of the impact zone where structures fail completely rather than sustain repairable damage. NOAA’s National Hurricane Center documents that the most exposed Gulf Coast and Atlantic locations — Southeast Louisiana, coastal North Carolina, South Florida — experience a hurricane of any category within 50 nautical miles approximately every 5-7 years. Because complete destruction is overwhelmingly a major-storm outcome, the relevant frequency is the major-hurricane return period: NOAA’s own worked example is a 20-year return period, meaning a Category 3-or-stronger storm passes within 50 nautical miles about five times per century, or roughly a 5% chance in any given year. Only that strike frequency is directly published. The second factor — the share of homes in the exposure zone that suffer complete rather than repairable loss when a major storm hits — is not a figure any of the cited sources states; treating it as an order-of-magnitude few-percent estimate yields an annual destruction probability near 0.2%, which compounds over a 30-year ownership period to roughly 1 in 17. That headline should be read as a bracketed estimate, not a measured rate: the uncertainty band runs from about 1% to 18%, driven almost entirely by how destructive the conditional term is assumed to be.
Hurricane Ian (2022, Category 4) is the clearest recent anchor for the scale of a major direct hit: the Insurance Information Institute ranks it the second-costliest US hurricane on record, at roughly $54 billion in insured losses (about $59 billion in 2025 dollars). What that dollar figure does not resolve is the per-home question — how many structures in the exposure zone are total losses rather than repairable — because insured-loss totals blend a large number of partial claims with a much smaller number of complete losses. The cited sources here do not publish a per-home total-loss rate for Ian or for major hurricanes generally, which is why the conditional destruction term above is presented as an estimate rather than a measured value. Post-storm reporting consistently shows that within the tightest part of a major storm’s track — the immediate landfall zone — near-total loss is common, while damage a few miles inland is more often repairable; that steep gradient, not any single published rate, is what makes the conditional term so uncertain.
The uncertainty range on this estimate is wider than for most entries on this site. The annual strike probability varies by an order of magnitude across the US coastline — from roughly 20%/yr for some SE Louisiana locations to under 1%/yr for New England — and the conditional destruction rate ranges from under 1% for a glancing Category 1 at a modern-code site to near 100% for a Category 5 storm surge zone. The two factors that dominate individual exposure are building type and elevation: manufactured homes are near-certain losses in a direct Category 3+ hit, while post-2002 Florida Building Code frame construction on elevated foundations has survived major storms with repairable rather than total damage. The financial risk is compounded by the gap between wind insurance (standard homeowners policies) and flood/surge insurance (NFIP, which is separate and often not purchased), meaning many coastal homeowners with high physical destruction risk carry insufficient coverage for the specific mechanism — surge — that causes the most complete losses.
Related tidbits
A high-risk Gulf Coast location sees a hurricane pass within 50 nautical miles about 2.9% of years, which works out to roughly a 1 in 17 chance of a destructive strike across 30 years of homeownership. Most coastal owners expect damage, not total loss.
Claim ledger
Every number below is what each source reported, with the verbatim quote we relied on and how we arrived at our figure. Click any link to verify directly.
1/3 sources independently verified verbatim against the cited source
-
[1] National Oceanic and Atmospheric Administration — What are the chances a hurricane will hit my home? Verified
What are the chances a hurricane will hit my home?- Statistic
Highest-frequency Gulf/Atlantic Coast locations experience any hurricane within 50nm every 5-7 years; for major hurricanes, return periods are longer; maps available via NHC- Excerpt
“"The areas with the highest return periods for a hurricane of any category are coastal North Carolina, South Florida and Southeast Louisiana, about every 5 to 7 years. Coastal New England has the lowest return period at 30 to 50 years. For major hurricanes, the return period is longer. A return period of 20 years for a major hurricane means that on average during the previous 100 years, a Category 3 or stronger hurricane passed within 50 nautical miles of that location about five times." ”
- Source data from
- 2024-01-01
- Accessed
- 2026-05-14 · archived copy
- Verification
- Excerpt independently re-fetched and confirmed word-for-word against the cited source during our grounding audit.
- Calculation
- High-frequency locations: any hurricane every 5-7yr → annual P ≈ 14-20%. Major hurricane: NOAA's worked example gives a 20-yr return period → annual P = 5% (five Cat 3+ strikes per 100 years). This 5%/yr major-hurricane figure is taken verbatim from the source and used as the strike-probability term of the two-step calculation. The conditional per-home destruction term is NOT from this source — it is an engineering estimate disclosed in normalized.assumptions.
- Independence
- NOAA NHC return period analysis is derived from the HURDAT hurricane track database (1851-present), entirely independent of insurance claims data.
-
[2] NOAA Office for Coastal Management — Hurricane Costs
Hurricane Costs- Statistic
Tropical cyclones caused over $1.5 trillion in damage since 1980, the most of any billion-dollar weather-disaster type, with an average cost of $23 billion per event- Excerpt
“"Of the 403 billion-dollar weather disasters since 1980 (as of December 31, 2024), tropical cyclones (or hurricanes) have caused the most damage: over $1.5 trillion total, with an average cost of $23 billion per event. They are also responsible for the highest number of deaths: 7,211 since 1980." ”
- Source data from
- 2025-01-01
- Accessed
- 2026-07-12 · archived copy
- Calculation
- Context only — aggregate loss magnitude; not used in the per-home probability calculation. Confirms tropical cyclones as the costliest billion-dollar disaster type ($1.5T+ total, $23B/event). The page does NOT state a per-home destruction rate or a "mean annual damage" figure, so it does not bear on the headline estimate.
- Independence
- NOAA NCEI Billion-Dollar Weather and Climate Disasters data is compiled from FEMA, insurance industry, and state/local damage assessments; independent of NOAA NHC track data used in the return period source.
-
[3] Insurance Information Institute — Facts + Statistics: Hurricanes
Facts + Statistics: Hurricanes- Statistic
Hurricane Ian (2022) ranks as the 2nd-costliest US hurricane by insured losses: $54.0 billion when it occurred ($58.9 billion in 2025 dollars)- Excerpt
“"Top 10 costliest hurricanes in the United States (insured losses, $ millions): 2 | 2022 | Hurricane Ian | $54,000 | $58,854 (in 2025 dollars)." ”
- Source data from
- 2023-01-01
- Accessed
- 2026-07-12 · archived copy
- Calculation
- Used only to anchor Hurricane Ian's scale as a recent major (Cat 4) landfall — its ~$54B insured loss makes it the 2nd-costliest US hurricane on record per III. NOTE: III does NOT publish per-home counts (no "30,000 homes damaged", "5,000 demolished in Lee County", "Fort Myers Beach", or "776,941 claims" text appears on the page), so the conditional per-home destruction rate used in the headline is NOT drawn from this source; it is disclosed as an engineering estimate in normalized.assumptions.
- Independence
- III's costliest-hurricanes insured-loss table is compiled from insurer/catastrophe-modeler (Aon, Verisk/PCS) loss estimates; independent of NOAA NHC track data used for the return-period term.